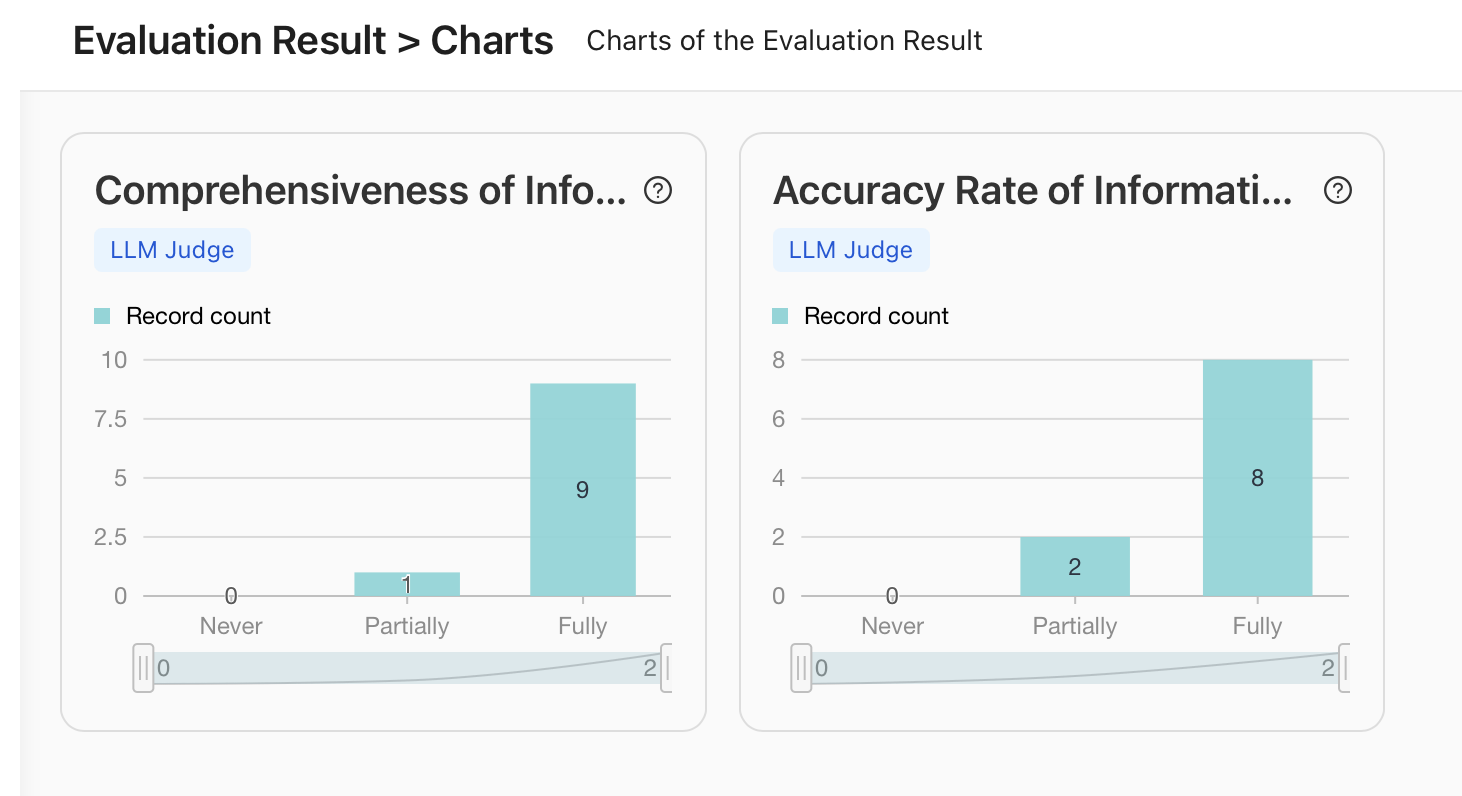
Evaluation Results Charts
The Charts section provides a visual representation of your AI model's evaluation results, allowing you to quickly assess performance across different metrics. These visualizations help identify strengths, weaknesses, and areas for improvement in your Agent's performance.
Overview
The Charts view displays evaluation metrics as bar charts, categorizing results into performance levels (Never, Partially, Fully) for each metric. The metric selection is custom and can be found in Evaluation set up page

Related Features
For more detailed analysis of your evaluation results, you can also explore:
- Logs: View detailed test cases and individual evaluation results
- Report By Agent Data Scientist: Get AI-generated analysis and recommendations based on evaluation results