Observability Overview
Teammately's Observability features provide comprehensive monitoring and analytics for your LLM applications. This system helps you track requests, analyze performance metrics, and evaluate model responses to ensure quality and cost-effectiveness.
Dashboards
The Observability dashboard offers real-time insights into your application's performance:
| Feature | Description |
|---|---|
| Request Analytics | Track the total number of requests processed by your system |
| Performance Metrics | Monitor average latency across all requests |
| Cost Tracking | View total costs incurred from model usage |
The dashboard includes a visual breakdown of request volume over time, allowing you to identify usage patterns and potential anomalies.
The detailed log table displays information about each request, including:
- Timestamp
- Plan identifier
- LLM Judge evaluation results (Great, OK, Bad)
- Latency measurements
- Cost per request
- Input/output data (can be masked for sensitive information)
Settings
You can control your observability experience through the Settings panel:
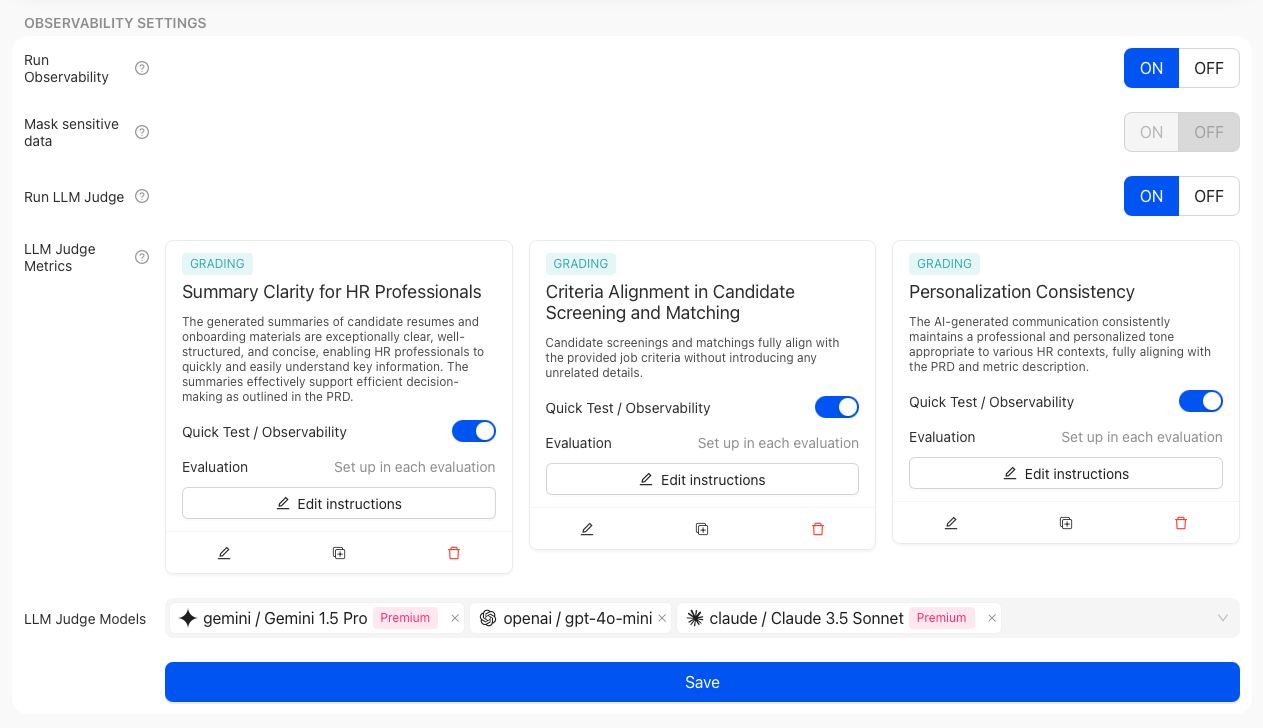
- Run Observability: Toggle to enable or disable the entire observability system
- Mask Sensitive Data: Option to hide sensitive information in request logs
- Run LLM Judge: Enable automated evaluation of model outputs
- LLM Judge Metrics: Configure which aspects of model responses to evaluate
- LLM Judge Models: Select which models to use for evaluating responses
These settings allow you to balance comprehensive monitoring with privacy and cost considerations.
Alert Setting (Coming Soon)
Our upcoming Alert feature will allow you to set thresholds for key metrics, receive notifications when metrics exceed defined thresholds and create custom alert rules based on your specific requirements for specified alert channel.